National Science Foundation of Statistics & Engineering
The Challenge
TThe National Science Foundation’s (NSF) National Center for Science and Engineering Statistics (NCSES) is the principal source of analytical and statistical reports, data, and related information that describe and provide insight into the nation’s science and engineering resources. This project was based in Washington DC, USA.
The challenge was to create an experience that better visualised the data, in turn helping the users navigate the data easier. Shared frustrations included poor formatting, no one version of the truth, great difficulties in exporting the required data, recoded variables and made the exported data difficult to use and the time it took as well as complex steps involved to get the data (cognitive load and barrier challenges).
The data visualisation platform of choice by the client was Qliksense.
The Approach
Discovery
This involved facilitating multiple design workshops over the course of 2 weeks to obtain the requirements and constraints for the design project. Due to the complexities and amount as well as priority of user needs, this created much friction within the organisation so time had to be spend educating the client and multiple leadership levels to ensure buy-in.
Ideation
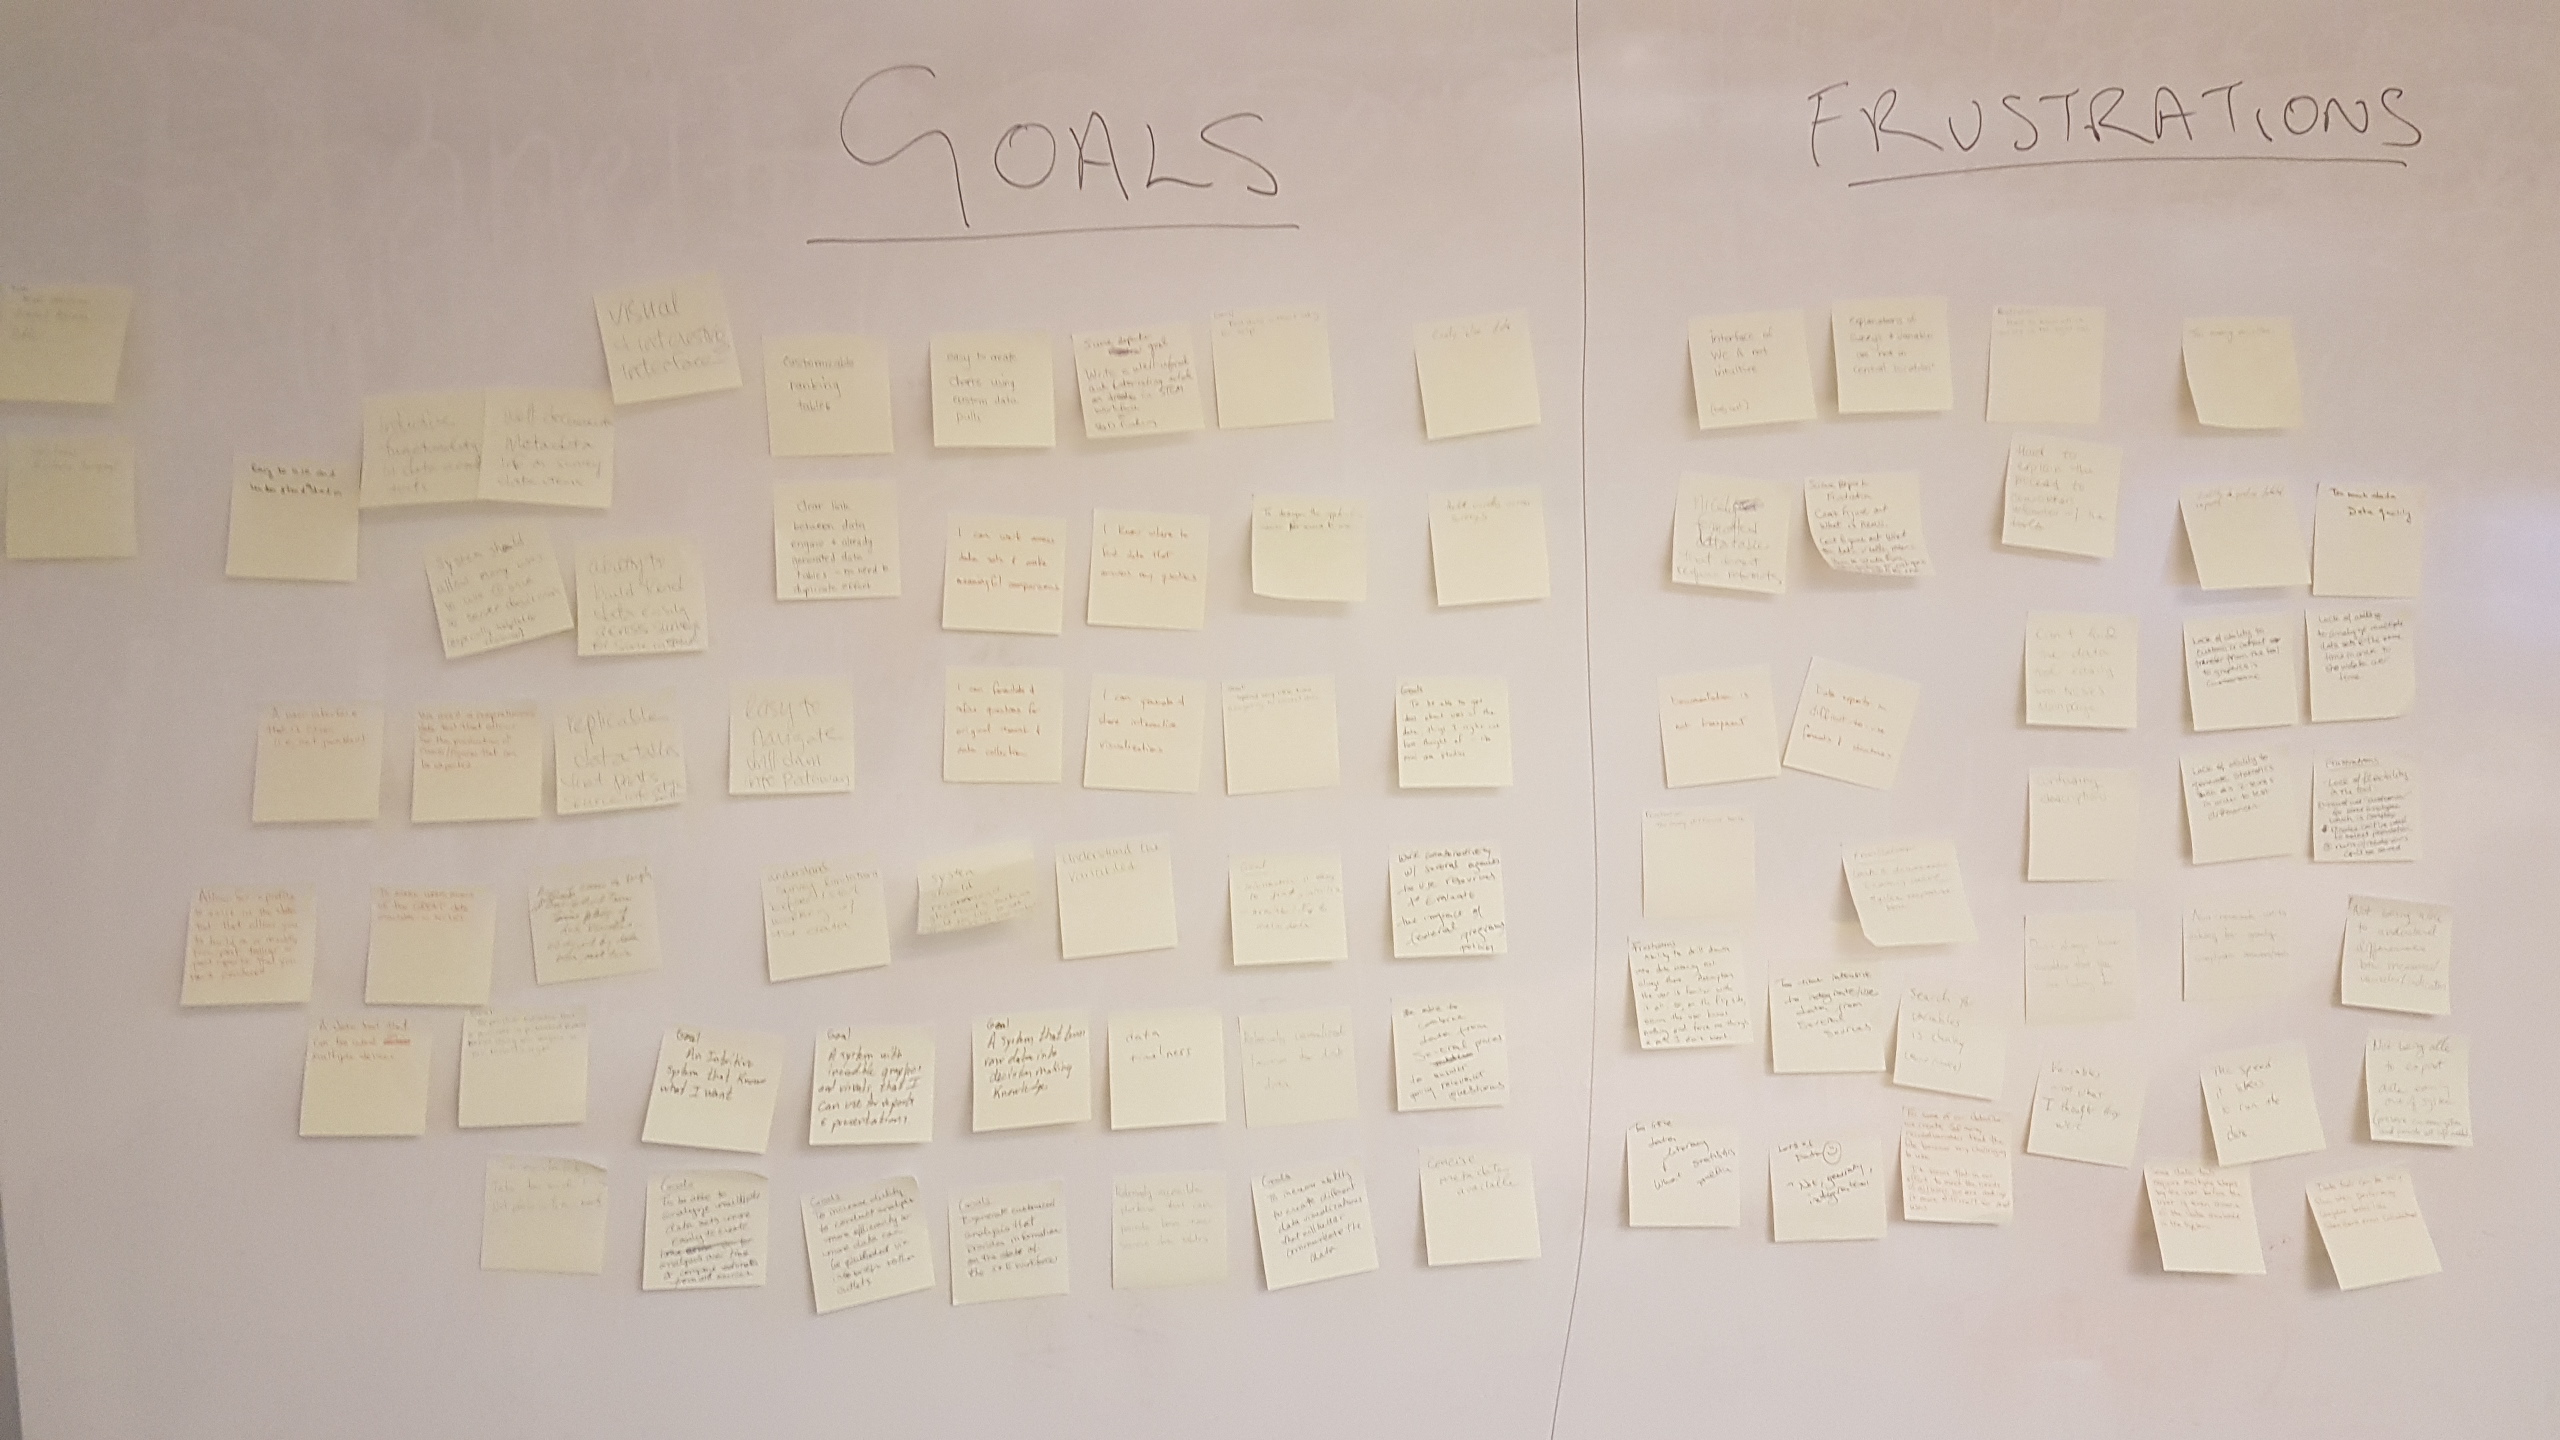
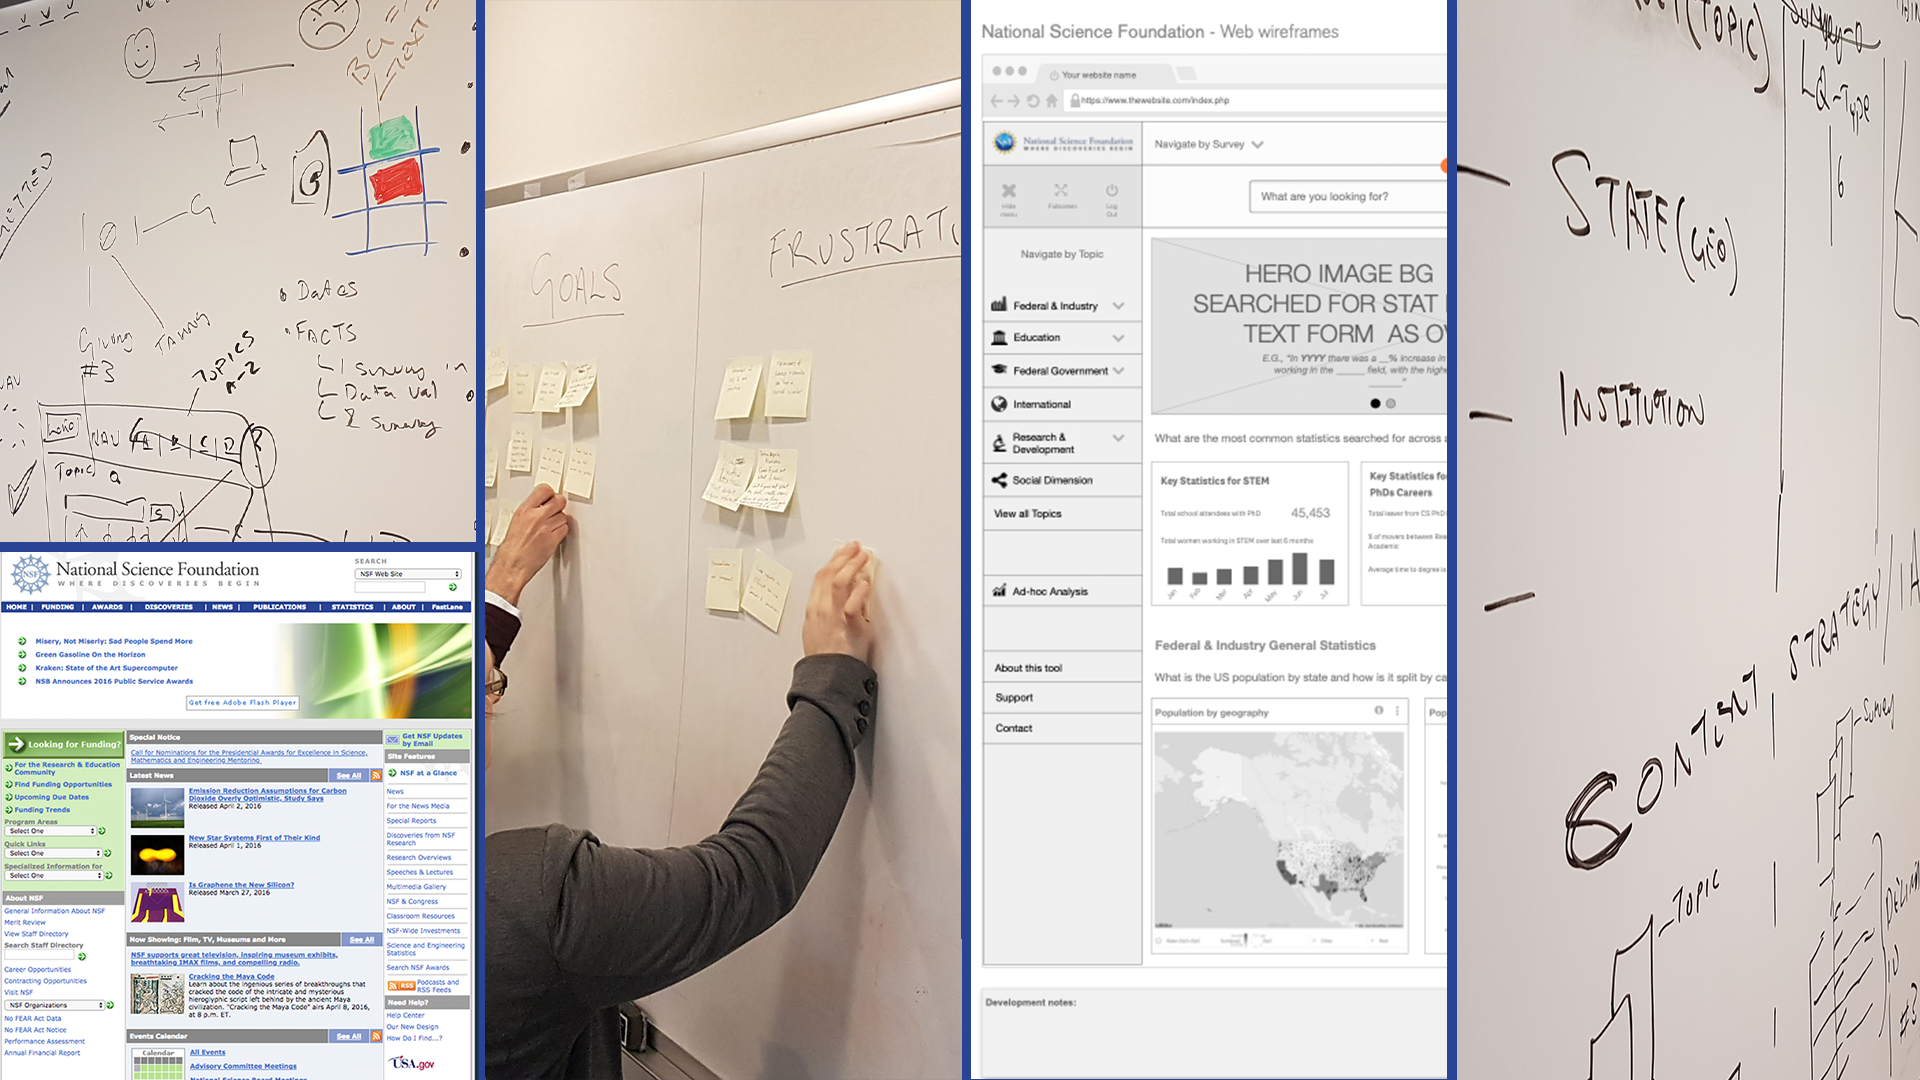
Time was spent understanding how the organisation worked, what their goals and frustrations were, who the main personas were, , sourcing the latest corporate style guidelines. Time was also spent understanding current solutions. Multiple meetings were held with the engineers, project management team to identify the best design approach.
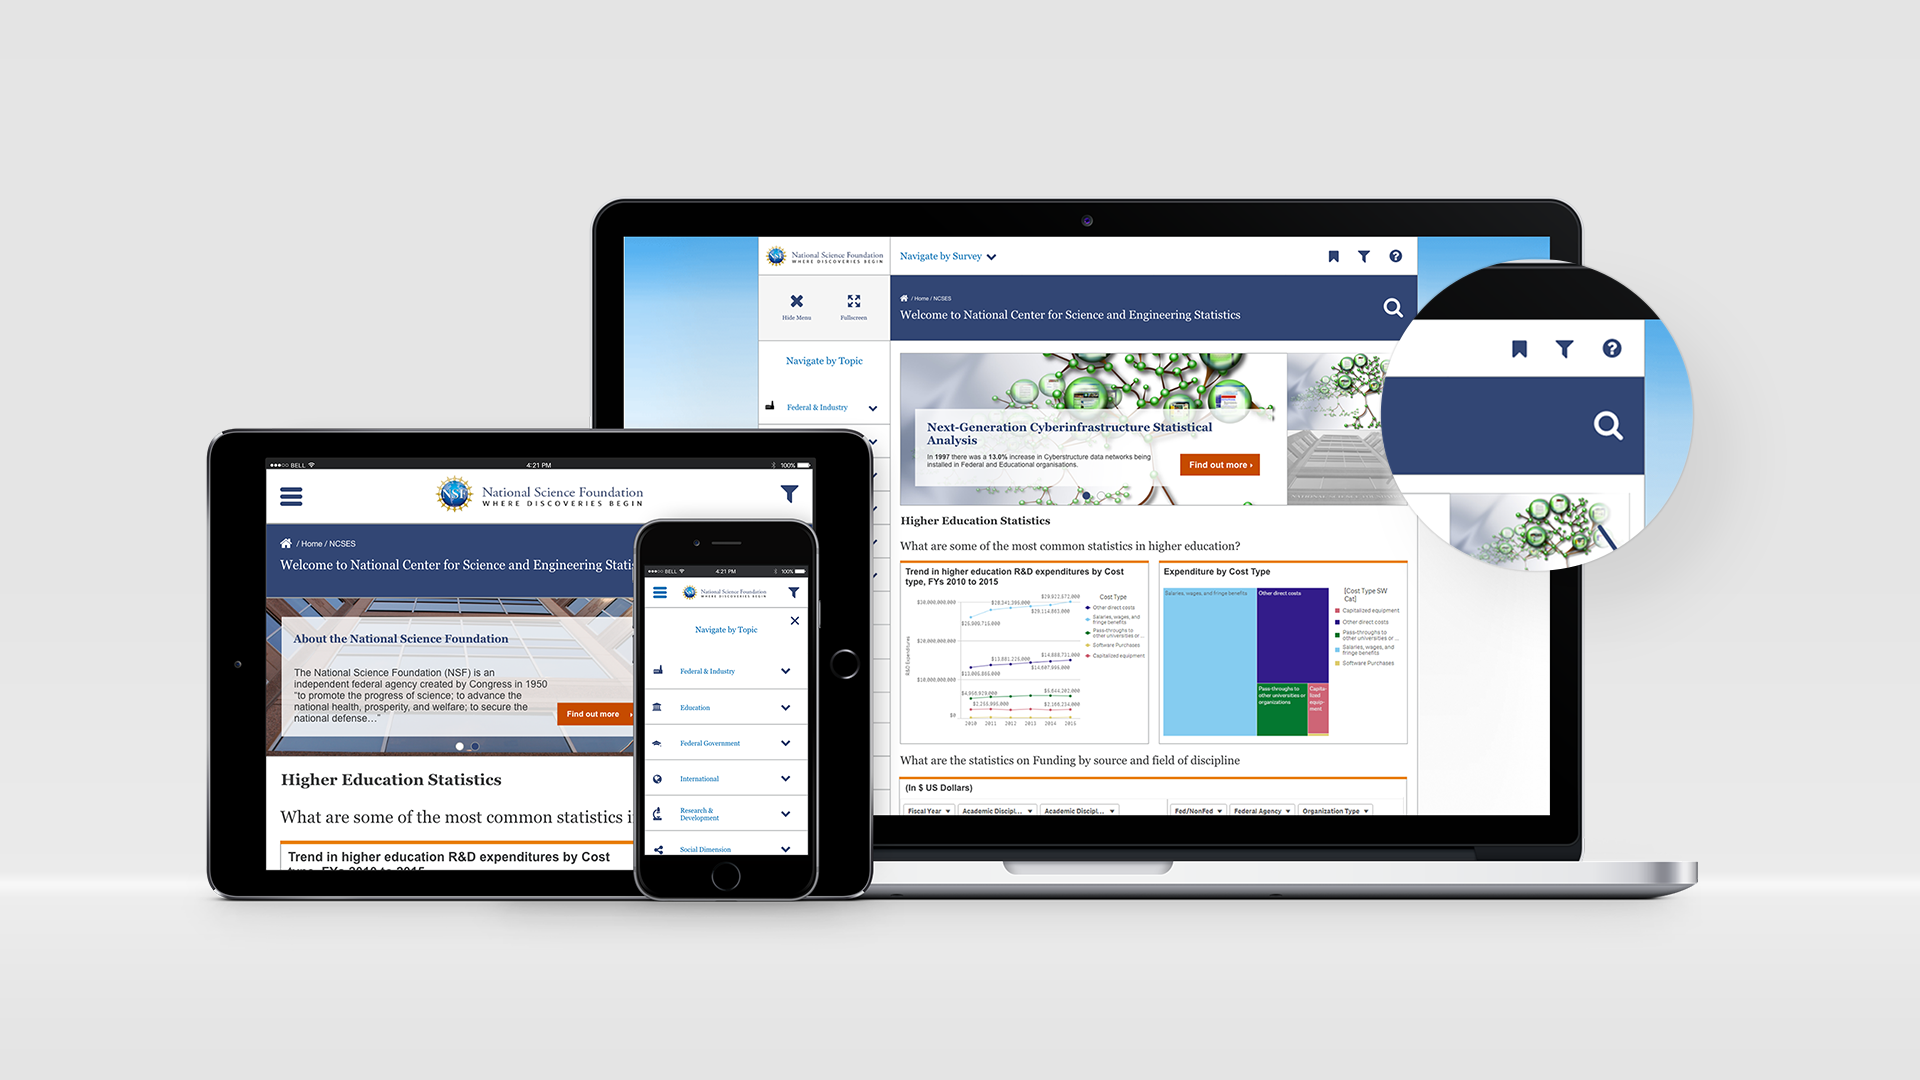
Design
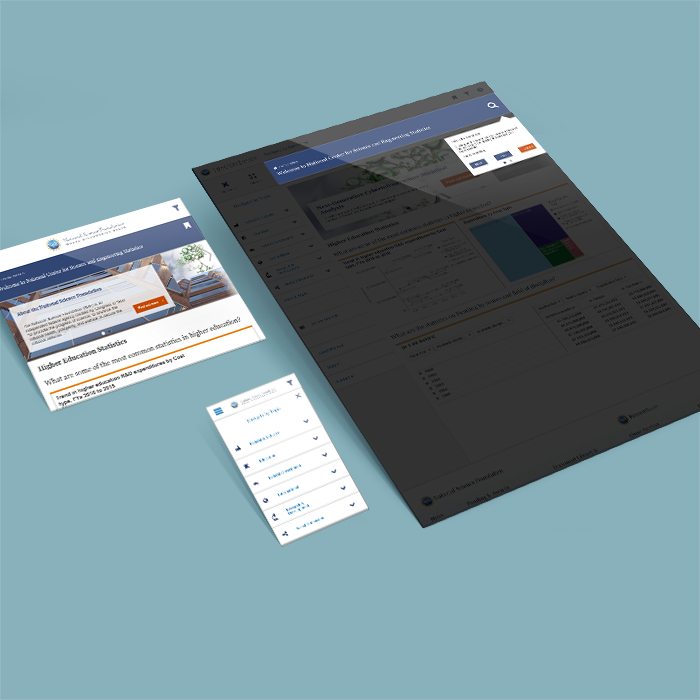
The design requirements included creating prototypes using Adobe XD for all responsive viewports. Adobe XD was the ideal choice to create a prototype that simulated various levels of interactions. Design handover documentation was created for solution architects who would build the visualisations as well as web assets for the web engineers.
Iterate
The the first release had an extremely successful adoption and the design has since gone live.
Tools & Techniques Used
- Multiple Discovery Workshops over 3 days
- Research
- Pen / Paper
- OmniGraffle
- Adobe XD
- Qlik Sense