
UX – Techniques or Definitions User Experience Professionals should use
What I mean by that is the techniques used by User Experience Professionals to gather the research and data that the deliverable is based upon. For example, individual interview techniques are not well suited for medium to larger groups of people. It’s not an effective use of thought process energy or time and it would take too long to gather the necessary data. So an approach better suited for groups such as a workshop would be more effective.
Granted, as mentioned in an earlier post, the UX process does take time and the correct expectations must be set with those who are going to receive the UX deliverable if something of high quality is to be handed over. However, I’ve used many different techniques to help speed up my UX process and utilised methods that help retain flexibility without sacrificing quality. Listed below are a few of the many techniques and definitions that I personally believe a User Experience Professional should know and use to support their UX client deliverables.
Brainstorming
This is a very popular way to get some ideas on the proverbial table. It’s linked strongly with being used with medium sized groups to just a few people. In this setting you generally focus on idea quantity and allow tangent ideas to be pursued especially if there is good traction around a given idea.
When used with a collective group of users, another term used for this is a workshop. I’ve facilitated various types of workshops to get a lot of data very quickly. As long as the participants understand what’s happening and have a level of trust and confidence in you (that you’re not going to sell on their collected data as an extreme example), they pretty much end up giving you everything you need and more. User Experience Professionals need to master doing that.
Gestalt Laws of Grouping
Proximity – The Law of Proximity indicates that elements that are near to each other tend to be perceived as a single unit. The simpliest example I can mention here is a form label. If it’s location on the page is nowhere close to the form field, radio button or dropdown, the user will not be able to easily identify its relation. Therefore it has lost it’s proximity.
Similarity -This is where elements, perhaps icons such as the “reverse/flip” and “back” icon may have been designed to look too similar. The user in this instance thinks that they are related when in fact they are not whatsoever.
Seeing how users respond to an A/B test to clarify a UI design that may conflict with the above may help you to understand where you may be going wrong, who it is your building the application for and identify how they think or behave in certain scenarios.
There are more practical techniques that can be of benefit when talking about grouping but the ones listed above are what I end up knowledge sharing most often – especially when working on BI projects that involve UX/UI design .
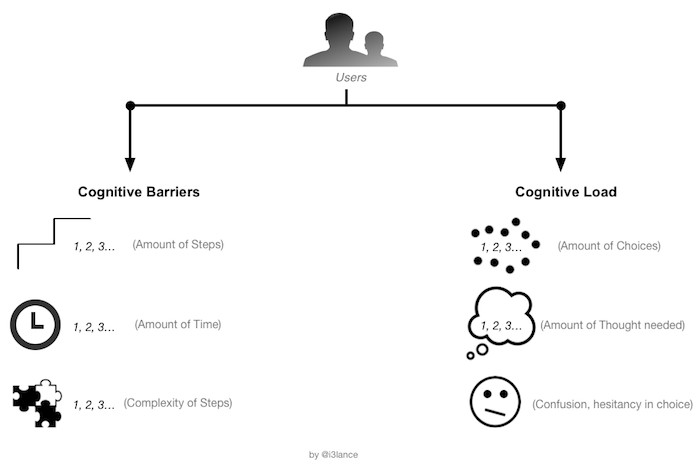
Understanding Cognitive Barriers vs Cognitive Load
This primarily refers to the amount of mental effort a user has to exert to process the information they encounter versus the obstacles that prevent them from processing the information they encounter. A digital example of this can be illustrated by the digital device you are using to read this post. When you first bought it, it no doubt ran fairly quickly. Over time it began to slow down.
The main contributor to this problem is because it has too many applications installed on it, may have performed several OS upgrades and so on. If you’ve owned your device for some time, you may already be making an effort to close down applications that you are not using so you can get the best out of your device whilst using it. It’s because you realise that the more things you have open on your device, the slower the device processes data or information. Of course, there are other things that also can slow down a device, but simplification in some form is always a top tip regardless of the type of device.
Humans are far more complex than any digital device, however the same basic law applies in a cognitive sense to us as users regarding how we process the information we see in a User Interface. As users, we can come across cognitive barriers or load that impact time and mental effort.
When it comes to BI-related projects that focus on data visualisation, this is a common pitfall. Project owners, sponsors or champion users generally send a lot of requests to the given developer or team. Most clients I’ve met have not set up a suitable process that can handle change requests effectively, so the given developer or team end up trying to factor in all requests, resulting in the user experiencing Cognitive Load and Barriers in multiple forms, meaning they have a poor user experience.
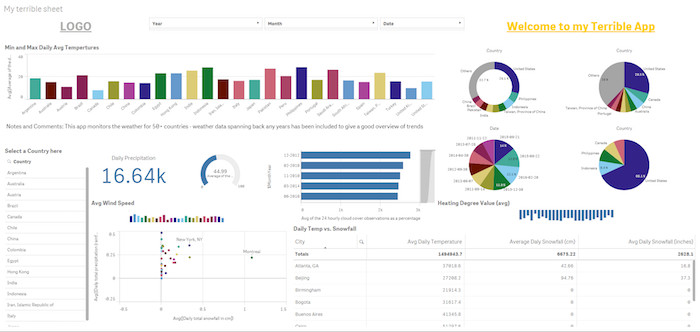
Cognitive Load: The list of what is wrong with the UX of the above example Business Intelligence UI is fairly extensive, but the main point being made is that there are too many visualisation objects on the canvas, therefore resulting in confusion for the user.
Without going into too much detail on the different types of Cognitive load to take into consideration, below are some suggestions to help combat a bad Cognitive experience:
De-clutter – Where appropriate, remove pointless images, links and what I like to call “visual garnish” from the User Interface. If it is not “useful” or “does not help the user”, then simply remove it. Exceptions may need to be made if you are required to stick closely to client brand guidelines.
Re-invention – The key here is NOT to feel the need to re-invent the wheel every time. Users are more likely to gravitate to using a User Interface that has universal icon or object placement because little to no mental/visual re-training is required.
Users are 89% more likely to remember logos shown in the traditional top-left position than logos placed on the right.
Source, NNg
Minimising mental tasks – A good example is contextual content. If it can be displayed in another way, such as an image then great. Simply put, a picture can tell a thousand words. You can also apply this to website navigation, but what has to taken into consideration is the type of navigational hierarchy being used.
The above can be applied regardless of whether your UX client deliverable is advisory or hands-on based.
Flexibility-Usability Tradeoff
This is where the requirements you may receive scream for total flexibility of the product being developed. This would mean that the end product would have to be very complex if it were to accommodate every single request. It would also quite likely make the product not that useful.
So a tradeoff has to be made. Meaning, creating a balance between a product that is flexible and one that is useful.
There is no badly designed car, it depends on the user
The quote doesn’t mean that all UX principles are thrown out the window so a flexible product can be delivered. What it means is that the clearer the users’ needs and wants are defined, the easier and more successful it will be to create a solution that fits those needs. Those needs are unique to the client. Clients tastes are also unique, making whatever the final design choice is great – from their perspective. It is when there are no clear requirements, is when a flexible approach is needed, not the other way round.
Remember, the requirements are unique for each user or group so what may be a great product to them may seem nonsensical to you – a User Experience Professionals – or a different group of users. There is no badly designed car, it all depends on the user.
So what about you? What techniques or foundations of UX learning do you think UX professionals should know and already be using? I’d be eager to hear from you.
Credits
Thanks to Sav Rakkar for providing the example Qlik Sense Dashboard.


Two Key Components To Levelling Up In User Experience (UX) - Desi Reuben-Sealey, UXC
[…] skills are important, they can be taught easily with pressure and time, and skills in turn will teach you how to hone […]